Cópia literal do texto extraído de: IP Checkups: an eye on invention (https://www.ipcheckups.com/blog/patent-landscape-analysis-overview/)
What is Patent Landscape Analysis & Why is it Important?
It is believed that 80% of published science and technology information contained in patents is not published anywhere else. There are literally tens of millions of published patents and patent application references available for review by the public. This overwhelming treasure trove of information can only be made useful by identifying the critical, relevant references in a given technology and then analyzing those references in a manner that provides information for actionable decision making.
Patent landscape analysis, often referred to as “patent mapping” is a proven multistep process, employing computer software and human intelligence, to parse through, organize and extract value from this vast amount of information. In a nutshell, patent landscape analysis provides insight into the innovations that underlie technology and products. A completed patent landscape analysis project consists of a set of technical references and accompanying analytics from which important legal, business, and technology information can be extracted. This information enables large corporations, startups, universities, research institutions, and investors to understand and make informed decisions prior to investing time and money into new technology and product development opportunities.
A thoughtful patent landscape analysis managed by a knowledgeable technical/patent expert who understands the underlying technology and the principles of intellectual asset management provides the end-user with valuable, actionable information. The value of the patent landscape analysis is further enhanced if thought leaders from R&D, marketing, legal and business development groups are engaged during the process. The information derived from a patent landscape analysis is applied within an organization to generate novel technology, to identify possible companies or technologies to license or acquire, to design around others’ technology to side-step litigation, or to avoid spending time and money on duplicating technology that has been developed previously and may already be on the market.
What are the benefits of performing Patent Landscape Analysis? Who are the beneficiaries?
Patent landscape analysis provides an excellent platform to encourage thought leaders from different departments of an organization to communicate regarding key business issues. Patent landscape analysis enhances inter-departmental communications and stimulates a holistic and unified internal business process that permeates throughout the organization.
- Researchers and scientists gain current awareness (understanding the “state of the art”) and learn important details about a given technology and potentially build, expand, improve, or modify that art.
- Business development teams identify who are the important assignees (owners) of the relevant technology. This is useful for considering potential merger/acquisition partners, in/out licensing opportunities (open innovation), competitors, suppliers, or customers and to assess whether it makes more financial sense to develop the technology in-house.
- Marketing, competitive intelligence, commercial strategy, and human resource teams gain early insight into what innovations competitors and their inventors have in the development pipeline and what products competitors are betting will be successful in the market. Looking at patent filing trends in conjunction with market research is useful to determine the commercial phase of the technology and whether it is in its infancy or is in a mature or declining phase.
- Legal teams, whether in-house our outside counsel, use a patent landscape analysis to understand the relationship between competitive products and patent protection for competitors and where potential product or process innovations may be barred because of numerous patent references or broad patent claim language. If performed early in an R&D project, answering this question can save considerable time, money, and human resources. Legal experts can work with technical and business development teams to assess new R&D opportunities by finding gaps in the landscape (patentability, novelty or “white space” analysis), determine which patents are expiring or have not been maintained to inform an overview of how “crowded” or “open” a technology area is, and identify potential licensees or infringers.
- Executives, high-level strategists, and investors gain insight into the opportunities and risks that exist in light of competitive R&D and product development initiatives, new “areas” for acquisition or investment, and how to develop and maintain a sustainable growth strategy.
- Human resources and recruiters can identify and hire the leading innovators (inventors) in a technology.
What are some of the steps involved with performing Patent Landscape Analysis?
The fundamental idea of patent landscape analysis, sometimes referred to as patent mapping, is to review and organize the patent activity in a technology area. Ideally, you have engaged a patent landscape team consisting of a patent analytics expert, as well as experts from R&D, marketing, competitive intelligence and legal that are familiar with the technology area to be analyzed and have time to commit to the project. Steps involved with createing a successful patent landscape analysis include:
- Establish the purpose of the patent landscape analysis. Why is this patent mapping project being undertaken (i.e. idea generation, ‘white space’ analysis, design around, competitive intelligence, patent filing strategy/patentability, risk management/validity/freedom to operate, monetization, M&A, etc.)?
- Determine which patent search and analytic software and/or third party services that will be used to perform or assist in the project.
- Your landscape team will agree on the boundaries of the technology area of focus. This includes a consideration of whether to include product terms, technology alternatives, multiple application areas in the search, and to agree on the goals and outcomes of the patent landscaping project.
- Determine which countries to include in the search, how far back in time to look, whether to include abandoned patents, family members, equivalent versions of patents etc.
- Perform preliminary searches across patents and technical literature and work with the team’s technical and market experts familiar with the technology area to identify a set of relevant keywords, patent class codes and organizations working in the technical area.
- Generate an initial training set of documents that are relevant to the technology area and review those documents to identify additional and refined technology, product and/or application areas in which to categorize the patent information.
- Use keyword, patent class code, citation mapping and/or semantic search strategies. Identify lists of patents that are relevant to each technology, product and/or application sub-area.
- Review and sort the patents within each relevant technology, product and/or application sub-category. This can be done through automated means (quick, yet less accurate) using keyword and international class code searching. Or manually (time consuming, yet very accurate) by reviewing Titles, Abstracts and/or Claims. Manual review offers the additional benefit of being able to add meta-data, comments and/or value rankings to each result. This will result in a more robust and valuable output.
Patent Analytics: What do you do next, how do you analyze the data?
After the information is organized into relevant categories, you must analyze the data to develop actionable conclusions. A few examples are listed below:
- Patent filing velocity charts enable you to visualize the amount of change in activity in each technology, product, or application area over time. This is useful to understand how much growth has occurred in the area, and be predictive about when activity might start to level off. This can be particularly useful if paired with market research including related product sales data.
- Top assignee tables provide insight into which large companies, startups, universities, and others are most focused in each technology, product, or application area. This is useful to identify potential partners, customers, licensees, acquisition candidates or organizations that might be using your technology evidenced by information that is disclosed in their patents (i.e. those discussing technology in their patent filings to which you own the underlying patent rights).
- Items 1 and 2 above can be combined to visualize which players are spending money (via patent filings) in which categories more recently and which companies may have slowed investment in a technology area. This can further lead to comparing the R&D spending (via patent filing activity) in a variety of technology areas compared to other competitors R&D spending in the same and/or other technology, product, or application areas.
- Patent claims in each technology, product, or market area can be scrutinized and mapped against other patents or products for legal analysis pertaining to validity, patentability, or freedom to operate.
- High-level patent landscape maps or visualizations can be analyzed for research, discovery and “white space” opportunities. These graphic visualizations can also be useful for communication and marketing tools – especially to non-patent experts and investors.
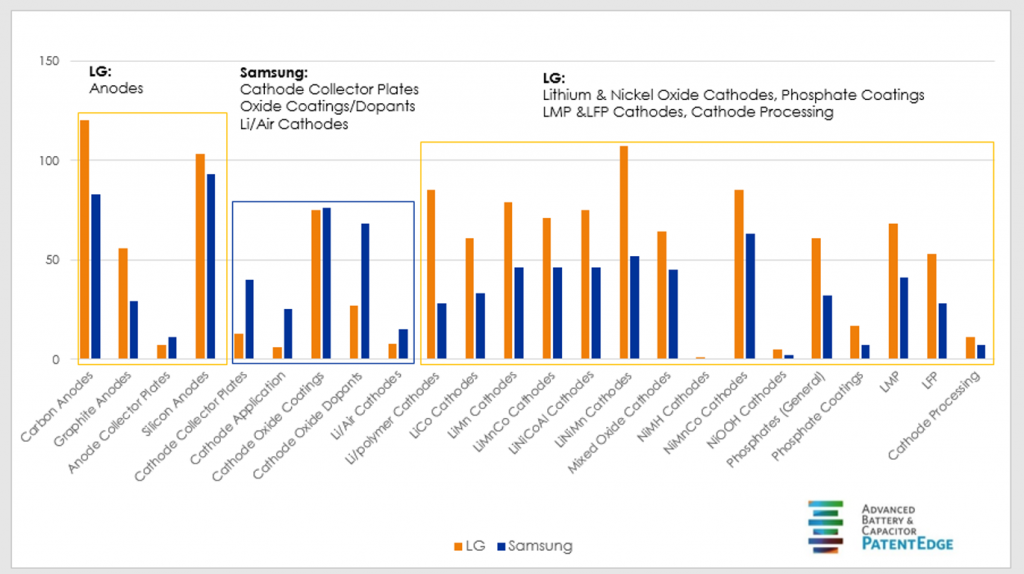
Figure 1: Depicts the worldwide patent activity of LG and Samsung from 2016 in the area of battery electrodes. Chart courtesy of The Advanced Battery & Capacitor PatentEdge.

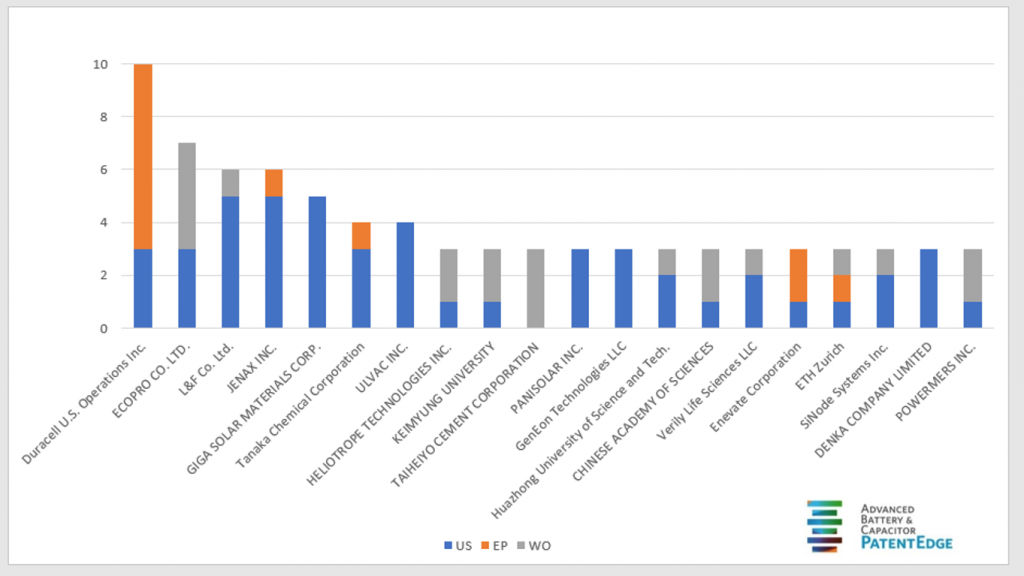
Figure 2: Depicts the worldwide patent activity of 2016-new entrants in battery electrodes, (those company’s that did not have a patent publish related to Electrodes in the prior year). Chart courtesy of The Advanced Battery & Capacitor PatentEdge.

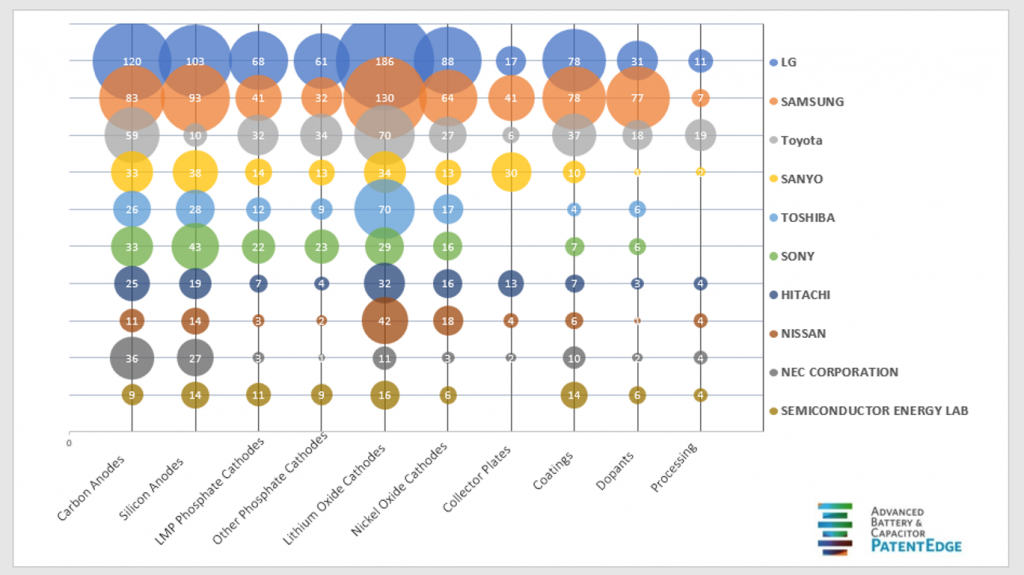
Figure 3: Depicts the top assignees patent activity of 2016 as relates to the top 10 electrodes categories from the ABC PatentEdge. Chart courtesy of The Advanced Battery & Capacitor PatentEdge.
What are the essential tools necessary to perform Patent Landscape Analysis?
In order to perform patent landscape analysis, users first need access a patent search system:
- Free options include: Google, The Patent Lens, and the European Patent Office.
- Commercial options include: Clarivate Analytics, CPA Global, and Lexis Nexis.
In addition, you will need to export the bibliographic information to a tool such as MS Excel to organize the data and create tables, charts, and graphs.
Although much of this work can be done in MS Excel, there are some advanced patent graphing and information management tools available that provide additional insights. These tools simplify and enhance the ability of the end users to understand the technical area. And finally, in order to perform the most effective patent landscape analysis, it is extremely valuable to set up a patent monitoring and management system to keep the data up to date. As soon as the landscape analysis has been completed, the data is out of date. Weekly, monthly, or quarterly updates make an enormous difference in providing real time information to end users. This results in the ability to make informed decisions in response to changes occurring in the technology landscape.
Some of the commercially available tools that offer advanced graphing, as well as patent management and monitoring features include PatentCAM*, IP Vision, and Intellar.
As you can see, performing patent landscape analysis is no simple task. In 2015, the World Intellectual Property Office (WIPO) published a 131 page document entitled “Guidelines for Preparing Patent Landscape Reports”. This primer provides some additional details related to generating a patent landscape report.
Interested in learning more?
Please contact IP Checkups (510)225-1162. We would be happy to set up a demonstration of our PatentCAM™ software and share some patent landscape analysis examples with you.
About IP Checkups:
IP Checkups Inc (IPC) is a full-service patent analytics and research firm located in Berkeley, California. Founded in 2004, IPC provides competitive patent landscape analysis software and services to companies, law firms, universities, and investors in a wide-range of technology areas. Along with its team of experts with backgrounds in chemistry, biology, electrical and mechanical engineering, IPC has created proprietary patent monitoring and management software called PatentCAM™. IPC’s comprehensive approach to patent landscape analysis and mapping, monitoring and management is essential to staying far ahead of your competition. www.ipcheckups.com
* PatentCAM is software for managing and organizing patent landscapes that has been developed by IP Checkups, the author of this whitepaper.

